& treatment plans: best practice
KPI | Average Fat/Protein Ratio dividing |
Definition |
|
Related variables |
|
Threshold |
|
KPI | Average Protein Indication % |
Definition |
|
Related variables |
|
Explanation |
|
Threshold |
|
Additional information |
|
KPI | Average Fat Indication % |
Definition |
|
Related variables |
|
Explanation |
|
Threshold |
|
Additional information |
|
KPI | Milk Production Energy Corrected |
Definition |
|
Related variables |
|
Explanation |
|
Threshold |
|
KPI | Milk Production/Cow/Day (Milk/Cow/Day) |
Definition |
|
Explanation |
|
Threshold |
|
Misunderstanding |
|
explain the individual KPIs in detail. This time: Milk Yield KPIs.
KPI | Total Amount of Milk Produced (Total Milk Prod.) |
Definition |
|
Explanation |
|
Threshold |
|
Misunderstanding |
|
KPIs explained: Milk Yield KPIs
Each KPI is calculated in a different way. To better understand these KPIs, the tables below.
Feature | Definition | Refresh |
KPI current | Last 24h update 20 min | 20 min |
KPI Weekly avg. | Last 168h value divided by 7 | 20 min |
KPI trend | Value per day | Shortly after midnight |
KPI click through current | Last 24h value | Upon opening |
KPI click through average | Average | Upon opening |
Reports historic | Value per 24h | Shortly after midnight |
Reports today | Last 24h value | Upon opening |
Reports
Reports and trendlines are updated at midnight, starting at 00:00. The “today” values are calculated when opening. The different refresh intervals make it difficult to compare numbers, as the KPI value may differ from a report value, but between reports, values with the same parameter can also differ slightly.
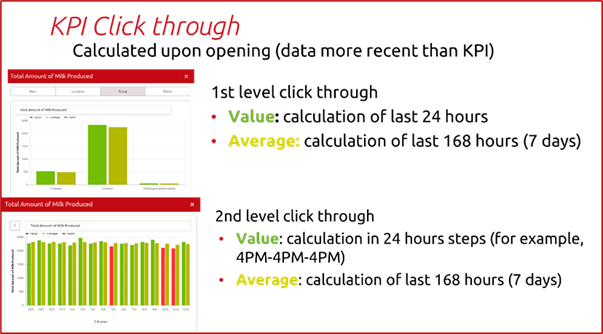
Click-through
By clicking through, you get access to more recent data, as calculated when opening the KPI. This allows a deep dive into the specific KPI and ensures that you stay informed about the most up-to-date values.
The first click-through level provides 2 values: the value and the average. The value represents the calculation of the last 24 hours and the average represents the calculation of the last 168 hours (7 days).
If you click through to the second level, new values appear. The value shows the calculation in 24-hour increments, for example if it is 4pm, the values are 4 PM- 4 PM- 4PM. The average (color in dark green) shows the calculation of the last 168 hours (7 days). If indicated in red, there is a deviation from the averages, this threshold differs for each KPI and is explained on the Lely Horizon Help page.
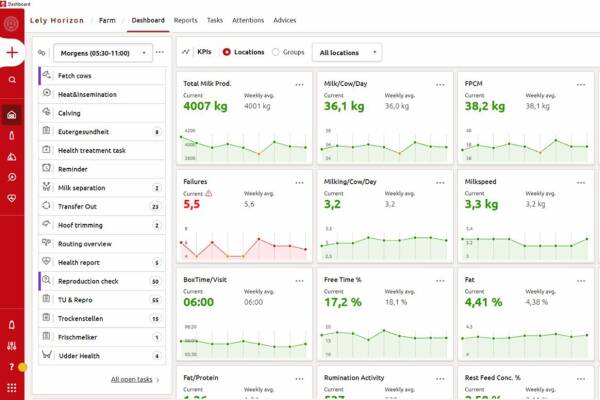
Dashboard KPIs
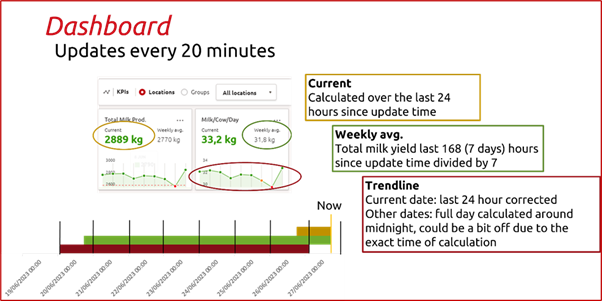
When you open the Horizon app, you start on the dashboard, which provides a quick snapshot of the current farm’s performance. The dashboard is updated every 20 minutes to show the latest values. A KPI is presented in different ways: as the current value, the weekly average and a trend line. Here is a breakdown of where these values originate:
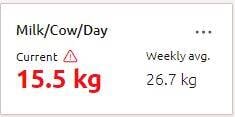
Current value: This indicates the KPIs performance over the past 24 hours since the last update (which is when the dashboard is opened and refreshed every 20 minutes).
Weekly average: This indicates the KPIs performance over the past 168 hours (equal to 7 days) since the last update (this is when the dashboard is opened and refreshed every 20 minutes).
Trend line: The trend line shows the values of the past 7 days per 24 hours (00: to 00:00), excluding today's value, which reflects the past 24 hours to today (the same as the current value). Keep in mind that updating KPIs starts at 00:00, and then updates each KPI one by one, therefore some KPIs are updated at 00:07 and others are 00:01, but the time interval is always 24 hours, so from 00:07-00:07 or 00:01-00:01.
March 2024
In this article, we will provide an insight into the calculations behind the numbers on the Horizon dashboard with general information about the dashboard itself and elaborate on the Milk Yield parameters that can be found there.

health task
KPI | Average Fat/Protein Ratio dividing |
Definition |
|
Related variables |
|
Threshold |
|
KPI | Average Protein Indication % |
Definition |
|
Related variables |
|
Explanation |
|
Threshold |
|
Additional information |
|
KPI | Average Fat Indication % |
Definition |
|
Related variables |
|
Explanation |
|
Threshold |
|
Additional information |
|
KPI | Milk Production Energy Corrected |
Definition |
|
Related variables |
|
Explanation |
|
Threshold |
|

KPI | Milk Production/Cow/Day (Milk/Cow/Day) |
Definition |
|
Explanation |
|
Threshold |
|
Misunderstanding |
|
explain the individual KPIs in detail. This time: Milk Yield KPIs.
KPI | Total Amount of Milk Produced (Total Milk Prod.) |
Definition |
|
Explanation |
|
Threshold |
|
Misunderstanding |
|
KPIs explained: Milk Yield KPIs
Each KPI is calculated in a different way. To better understand these KPIs, the tables below.
Feature | Definition | Refresh |
KPI current | Last 24h update 20 min | 20 min |
KPI Weekly avg. | Last 168h value divided by 7 | 20 min |
KPI trend | Value per day | Shortly after midnight |
KPI click through current | Last 24h value | Upon opening |
KPI click through average | Average | Upon opening |
Reports historic | Value per 24h | Shortly after midnight |
Reports today | Last 24h value | Upon opening |
Reports
Reports and trendlines are updated at midnight, starting at 00:00. The “today” values are calculated when opening. The different refresh intervals make it difficult to compare numbers, as the KPI value may differ from a report value, but between reports, values with the same parameter can also differ slightly.

Click-through
By clicking through, you get access to more recent data, as calculated when opening the KPI. This allows a deep dive into the specific KPI and ensures that you stay informed about the most up-to-date values.
The first click-through level provides 2 values: the value and the average. The value represents the calculation of the last 24 hours and the average represents the calculation of the last 168 hours (7 days).
If you click through to the second level, new values appear. The value shows the calculation in 24-hour increments, for example if it is 4pm, the values are 4 PM- 4 PM- 4PM. The average (color in dark green) shows the calculation of the last 168 hours (7 days). If indicated in red, there is a deviation from the averages, this threshold differs for each KPI and is explained on the Lely Horizon Help page.

In this article, we will provide an insight into the calculations behind the numbers on the Horizon dashboard with general information about the dashboard itself and elaborate on the Milk Yield parameters that can be found there.
March 2024
Dashboard KPIs
When you open the Horizon app, you start on the dashboard, which provides a quick snapshot of the current farm’s performance. The dashboard is updated every 20 minutes to show the latest values. A KPI is presented in different ways: as the current value, the weekly average and a trend line. Here is a breakdown of where these values originate:
Current value: This indicates the KPIs performance over the past 24 hours since the last update (which is when the dashboard is opened and refreshed every 20 minutes).
Weekly average: This indicates the KPIs performance over the past 168 hours (equal to 7 days) since the last update (this is when the dashboard is opened and refreshed every 20 minutes).
Trend line: The trend line shows the values of the past 7 days per 24 hours (00: to 00:00), excluding today's value, which reflects the past 24 hours to today (the same as the current value). Keep in mind that updating KPIs starts at 00:00, and then updates each KPI one by one, therefore some KPIs are updated at 00:07 and others are 00:01, but the time interval is always 24 hours, so from 00:07-00:07 or 00:01-00:01.